The Problem
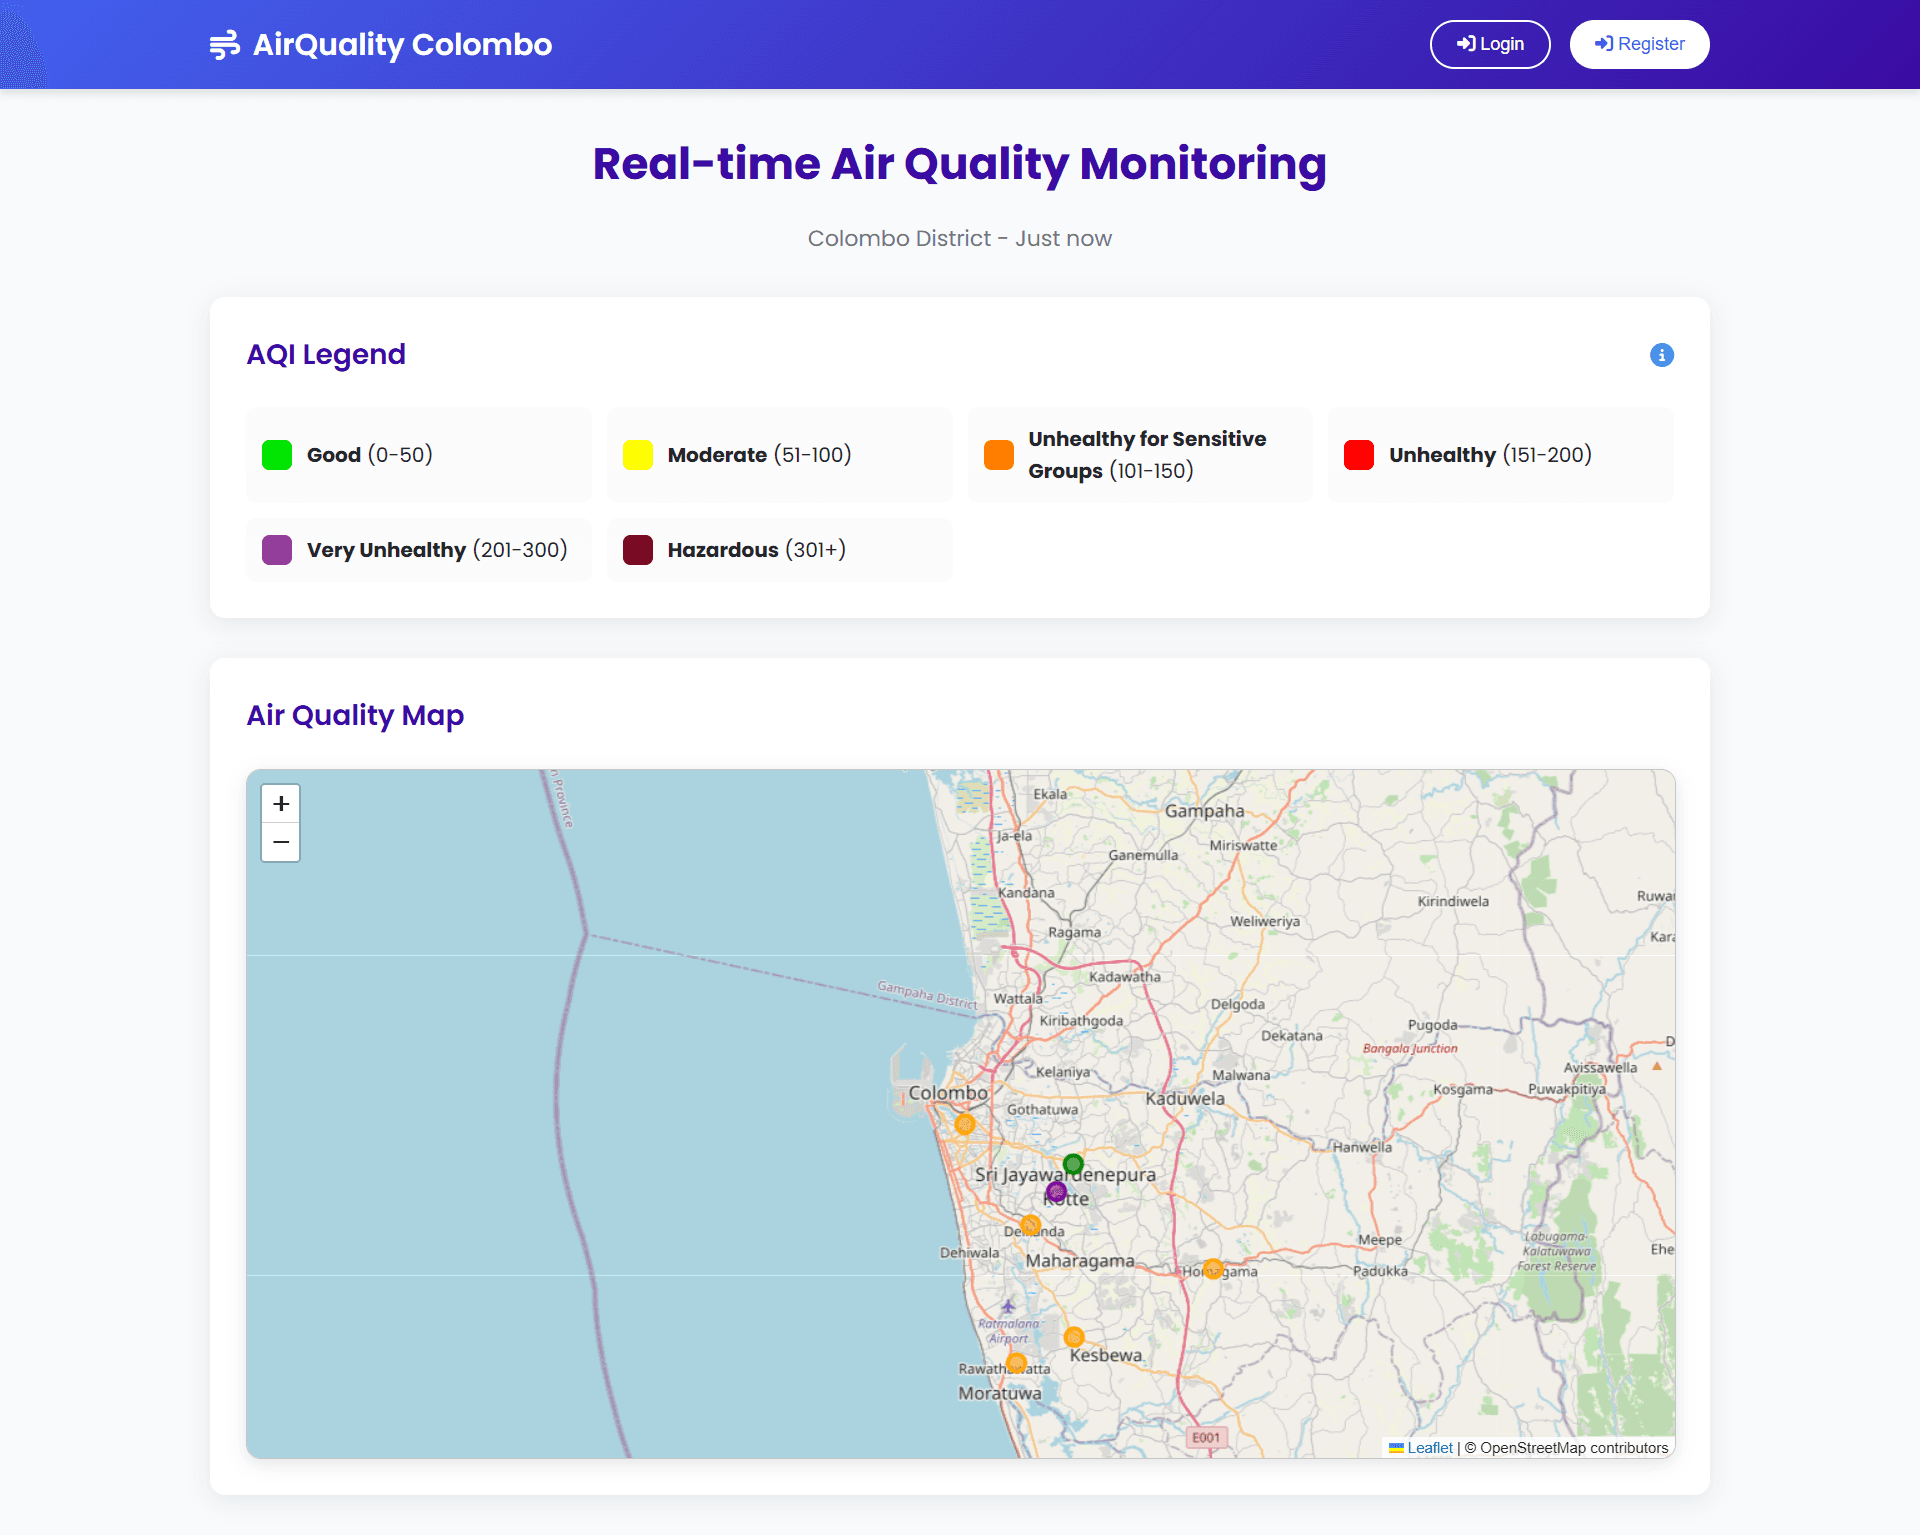
Environmental data often lacks accessible, centralized platforms that provide both geographical context and historical analytical trends for specific regions like Colombo.
The Solution
Architected a full-stack Laravel application that aggregates environmental sensor data, rendering it through interactive Leaflet.js maps and dynamic Chart.js visualizations for end-users.
Engineering Challenges
Data Visualization: Engineered dynamic, responsive data pipelines to feed real-time sensor metrics directly into complex frontend charting libraries.
Role-Based Access: Implemented secure administrative dashboards utilizing Laravel's built-in authentication and middleware systems.
Technology Stack
Backend
- Laravel (PHP)
- MySQL
Frontend
- Blade Templates
- Bootstrap
- Chart.js
- Leaflet.js
Project Gallery
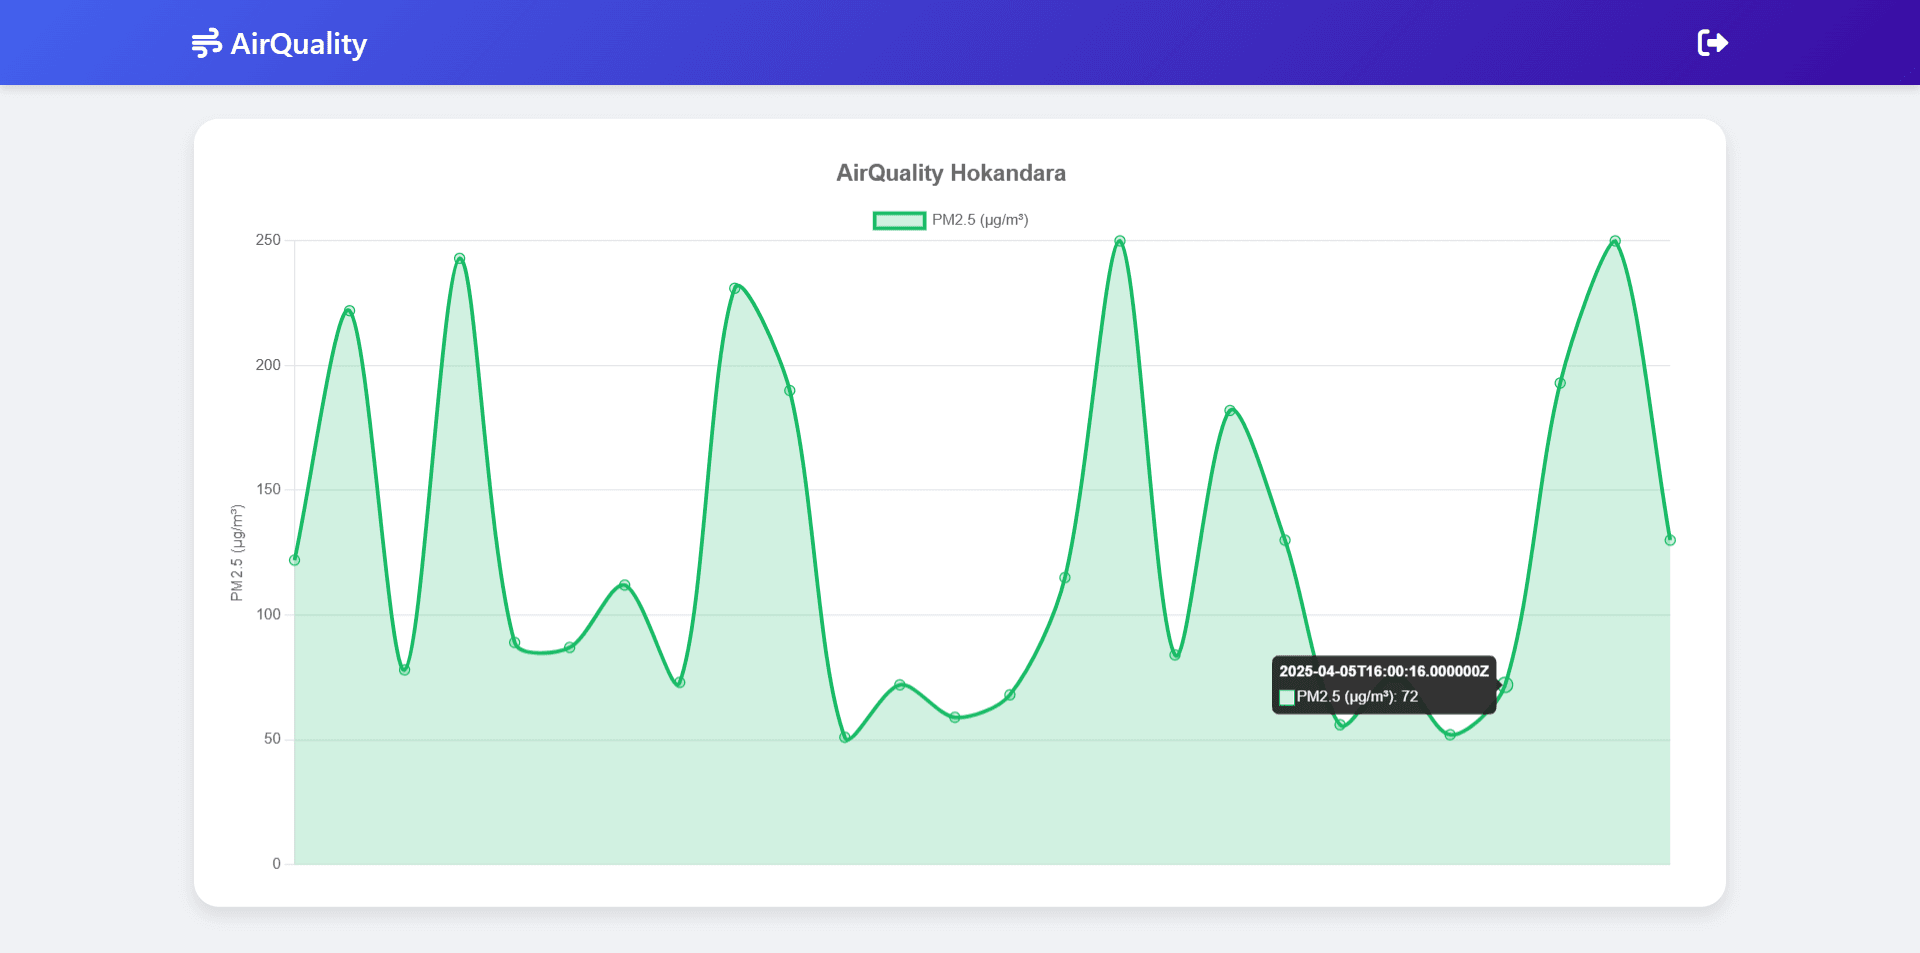
Image missing: https://raw.githubusercontent.com/kavindu-kodikara/Air/main/img/sensorChart.png
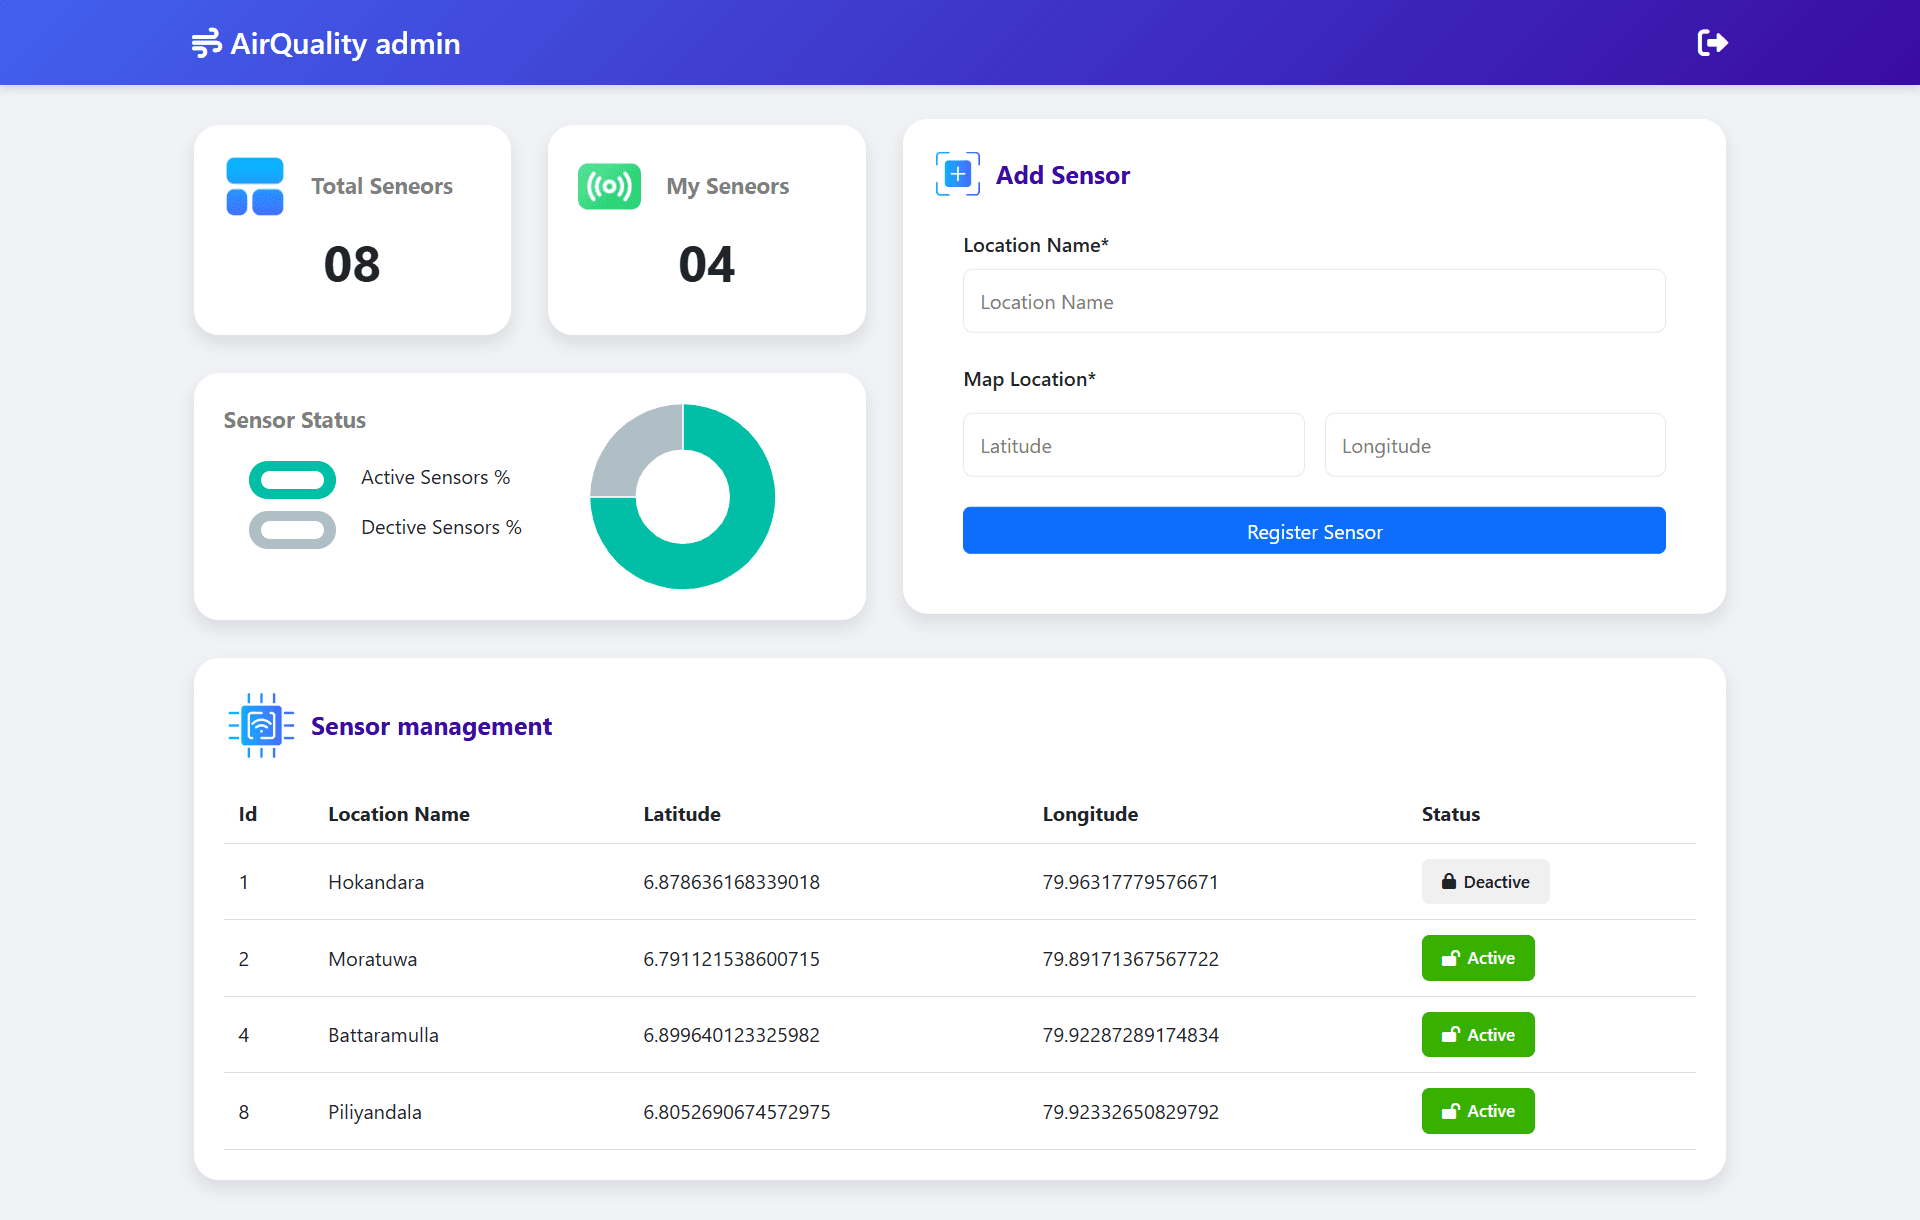
Image missing: https://raw.githubusercontent.com/kavindu-kodikara/Air/main/img/adminD.png
Results & Impact
- Showcased strong MVC architectural patterns and rapid full-stack development using the Laravel ecosystem.
- Created an intuitive platform capable of translating raw data into actionable environmental insights.